VRA Weekly Update: Market Update. Nasdaq Internals Weakening. More Evidence that PM, Miner Breakout is Real.
/Good Thursday morning all. New closing highs in Nasdaq with a golden cross in S&P 500 looking pretty certain today, even as most everyone that I know, speak with and follow feels like the bottom could drop out at any moment. With CV mass hysteria raging (again), many/most schools leaning towards not reopening, countless 1000's of businesses going under and 20 million Americans unemployed it feels almost impossible to be optimistic on the market/economy.
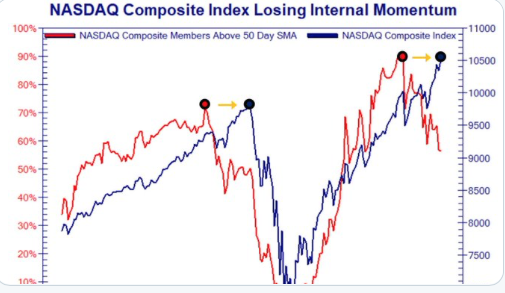
And there's this; even with new ATH's in nasdaq, a look under the hood shows weakness. The percentage of Nasdaq Composite stocks above their 50 dma (red line) is in a nosedive. With 5-6 Nasdaq stocks making up the vast majority of the indexes gains this year, its not hard to understand why.
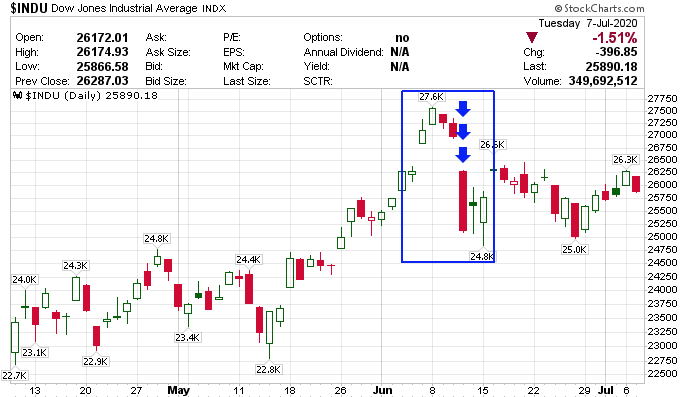
This market has a bit of a deja vu feeling to it. Smart money traders are talking about this...after last months (May) blowout jobs report, the market screamed higher that Friday with gains carrying over on the following Monday, with June 8th peak marking the Dow's post CV highs of 27,600.
Then 6/11 happened (chart below). Out of nowhere the Dow fell 1800 points (6%) with the Russell 2000 being hit 8%.
Fast forward to this past Friday's blowout jobs report and the mini-rally that followed. Notice the rally hasn't come close to the excitement from last months report. Today’s and tomorrow’s action, important. We're watching the Russell 2000 closely here as well. The R2K remains well below its 200 dma, cannot seem to manage even a decent rally attempt, and continues to flash sell signals on the VRA System.
But here's the repeating pattern that we expect to continue. The repeating pattern we've covered here often and on our daily podcasts (sign up at vrainsider.com/podcast);
The Fed needs these big declines in order to launch their next stimulus/QE program. It's not to easy to launch insert new trillions into the US economy when the markets are ramping higher. The Fed needs fear, if only for a few days, before acting. This is exactly what the Fed has done from those 3/23 lows. A well defined and repeating pattern of taking advantage of stock market sell-offs to launch their next QE program.
Tyler and I expect this pattern to continue. This is the Fed's tell. This is how they will add the additional trillions they have earmarked for US markets. This is how we intend to trade this market, in both VRA and Parabolic Options.
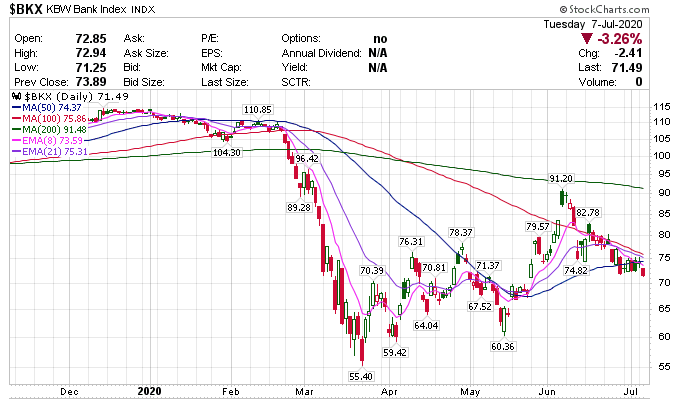
BTW, if you've seen a chart of US bank stocks...and remember, these are the Fed's bosses...you'll know exactly why the Fed must continue to flood the markets will liquidity. Technical analysts call this chart "death warmed over". Our case for the last 2-3 years has been that interest rates will continue to collapse...it's just gravity...with US rates ultimately going the way of Japan and Europe (negative). These are the unintended consequences of $21 trillion in global QE. Bank stocks can only trade in one direction with rates at 0%...lower. Central banks are stuck. They have no choice but to continue with QE...even as it drives rates and bank stocks lower. At some point...maybe 2030 (who knows)...this likely won't end well (but I've also heard that same story since I was a rookie broker with President Reagan in 1985).
More Technical Evidence That the Breakout in PM's and Miners is Real
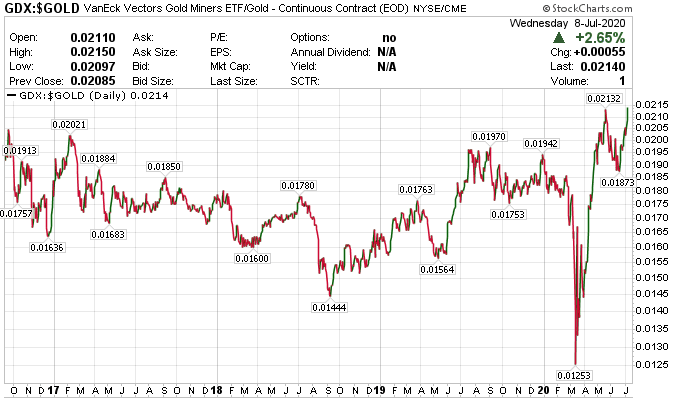
One of our top technical indicators for judging breakouts in PM's and miners is the GDX to Gold ratio, which tells us the relative strength of the miners to gold itself. The miners tend to lead the metals (in both directions) so when the miners are consistently outperforming gold by 2:1 or better, the potential for sharp moves higher increases.
The GDX:Gold ratio indicator continues to flash "buy", hitting new 4 year highs yesterday with the ruling average at better than 2:1 outperformance. Over the last two days the outperformance of miners to gold is more than 3.5 to 1.
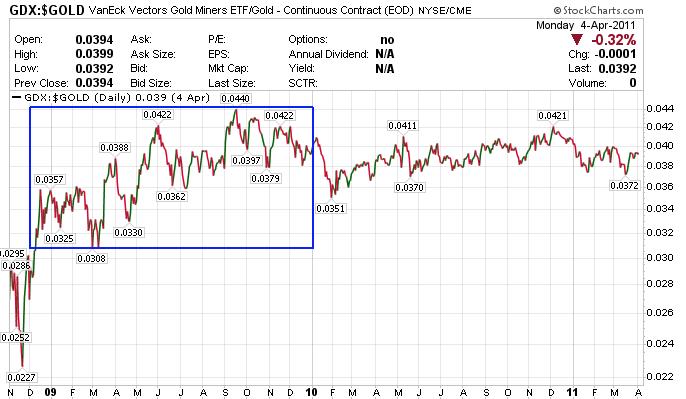
But it's this chart that tells us where we may be headed. This is the GDX to Gold chart from the 2008-2011 bull market. During much of this 3 year, 311% move higher in GDX, the GDX:Gold ratio surpassed 4:1. If PM and miners are approaching the near parabolic move higher that we expect, few groups will turn in better performances over the next 1-2-3 years than the miners. Including Nasdaq/tech/semis.
While the group is hitting heavily overbought levels, we want to see where this move takes us. Gold looks like it wants to take out its all-time highs of 2011, less than $100/oz away from current prices.
Until next time, thanks again for reading…
Kip
Since 2014 the VRA Portfolio has net profits of more than 2300% and we have beaten the S&P 500 in 15/17 years.
Join us for two free weeks at VRAInsider.com
Sign up to join us for our daily VRA Investing System podcast
