VRA Investment Update: Is The Gold, Silver and Miner Massive Bull Market of 2003–2011 About to Repeat?
/Good Thursday morning all. We just put out a VRA Alert to our member’s that we wanted to share here.
Is The Gold, Silver and Miner Massive Bull Market of 2003–2011 About to Repeat?
To understand why gold/silver may double over the next 3–5 yrs, with the miners jumping 300% to 500% in price, you must first understand the Feds history of major policy mistakes. Top of that list are their 17 straight rate hikes from ‘04-‘06, leading directly to the crash in housing, then the markets and economy and golds move from $375/oz to $1923/ozby 2011. Points 1,3 & 4 in the chart below represent Fed rate hike cycles (04 & 16) and the QE that followed (09 & 20) and of course the massive move higher in gold, silver and miners.
The next rate hike cycle is underway now….followed almost certainly by the next series of Fed policy mistakes. It’s a repeating pattern that has become high probability.

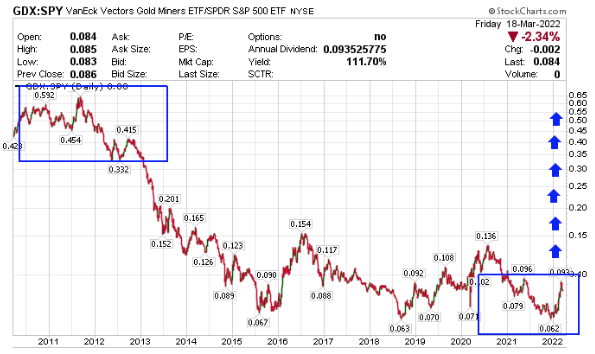
And this chart tells the tale. GDX to S&P 500 relative strength chart (back to 2011) gives you an idea of just how cheap the miners are to the broad markets, on a relative strength basis. Abysmally weak. Folks, the miners would have to rally for “years” just to fill this gap. We made the same case for energy stocks last year…and they’re seeing their sharp moves higher…but today, its the miners that are trading at historically low levels. And importantly, all of this is taking place while at the same time investors barely own the miners, with less than 3% of global portfolios having a position. This is the PERFECT contrarian buy signal, for a group that is ready to soar (and I haven’t even mentioned the global debt and fiat currency pictures). Now, imagine what this group might do should gold hit our target of $3500 and silver $60. Generational wealth creation.

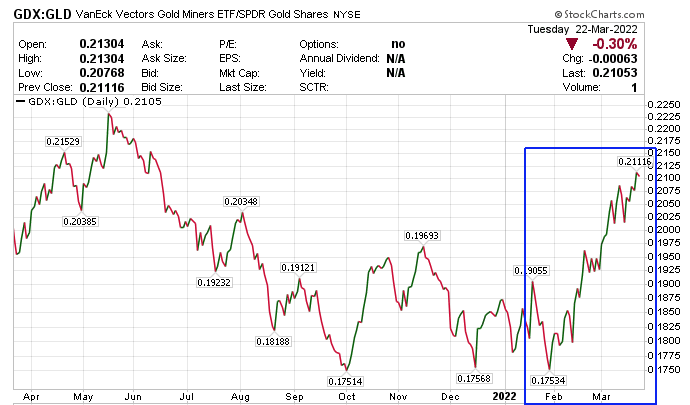
We see it in this important chart as well; the 1 year chart of the relative strength of miners to gold. Beginning last October the miners began to outperform gold, but that outperformance really began to kick in in late January with miners going near parabolic compared to the underlying commodity. This is a classic tell. Investors want to be aggressively long this group when the miners are leading.

We like everything about precious metals and miners, both fundamentally and technically;
- The world has more debt and fiat currency in circulation than ever, with a system run (completely) by the financial engineering of global central banks (led by J Powell and US Fed). What could go wrong…
- Inflation is at 40 year highs and based on multiple important indicators/inputs (oil, food prices, wages, etc) the Fed is fighting a battle that it has most typically won by putting the economy into a recession, hence all of the inverted yield curves that started popping up over the last 2 weeks. Again, inflation is always “currency inflation”…aka money printing…and protection against inflation has been one of the primary reasons to own PM’s and miners, from the birth of fiat currency. It is already beginning to appear that the Fed is planning, on the back end, for more QE.
- Fundamentally, this is an eerily similar set-up to 2004–2006, when the Fed was hiking rates 17 straight times, which sent PM’s and Miners (and stocks, btw) into major bull markets, followed by the housing/financial crash and launch of QE in 2009, which sent this group parabolic. To be clear, this set-up is bullish both for PM’s/miners and stocks.
- PM’s and miners love rate hike cycles (as we’ve been covering quite a bit of late). The biggest moves in this group (since 2003) have come in this exact environment and this exact timing.
- Multiple Golden Cross buy signals over the last day to month in gold, silver and GDX (both 50/200 and 100/200). High probability buy signals.
- The miners (GDX) have been outperforming gold since October, with near parabolic outperformance over the last month. When the miners are beating gold on a relative strength basis, it’s a classic “tell” that this group should be owned aggressively. And the leverage is always in the miners.
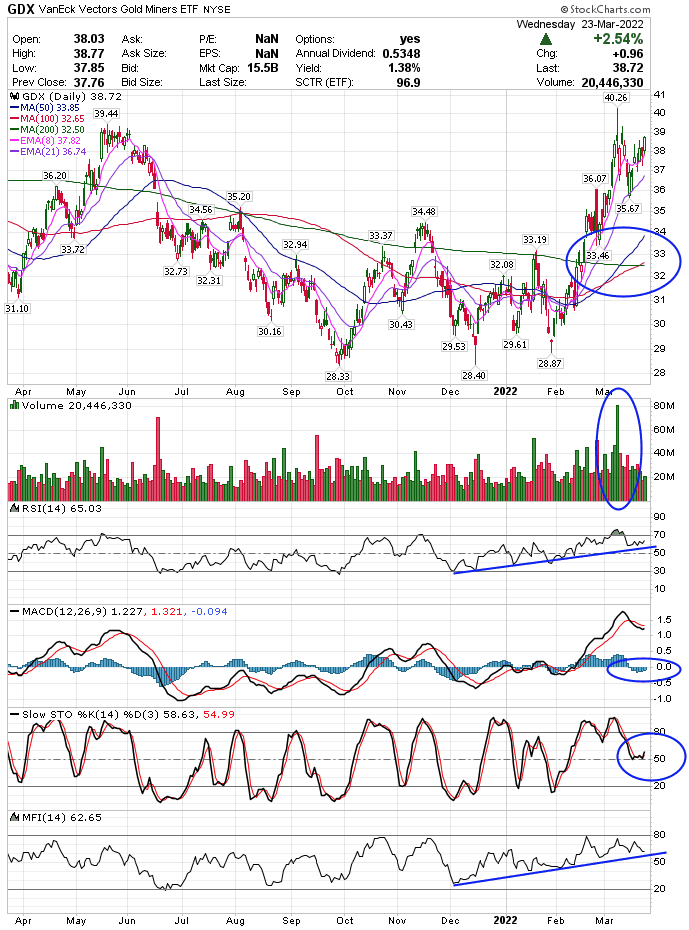
And this chart of GDX is the final tell:
GDX is above every moving average, with what I call a “catapult” chart setup. Following the “first shots fired” top and recovery move higher, should GDX break $40.26 (52 week high) we can expect the next parabolic move higher, first targeting $44/45 and then $50. GDX had a 50/200 dma golden cross on 3/11 and a 100/200dma golden cross yesterday. Volume is returning but should now begin to ramp. GDX is a buy on each of our VRA Momentum Oscillators with lots of room to run before hitting overbought, with near perfect trend line support in RSI and MFI. We should also get a fresh MACD buy signal within 2 days.

We are targeting massive gains from this group in both our trading positions and our VRA 10 Baggers. To learn more join us for our 14 day free trial at VRAinsider.com
Until next time, thanks again for reading….
Kip
Join us for two free weeks at VRAInsider.com
Sign up to join us for our daily VRA Investing System podcast
