Q2 Earnings Not Disappointing. Investor Sentiment Buy Signals. Oil and Energy Stocks Getting Cheap. November Mid-Terms, The Bears Greatest Hope.
/Second quarter earnings are beating estimates, across the board. Roughly 9% of S&P 500 co’s have reported and something like 80% have topped analyst estimates. While this is not unusual, the following is; fewer than 5% of co’s that have reported have tamped down Q3 earnings estimates.
So far, so good. Banks are beating and their share prices are rising (a good tell). We see the same action, most everywhere we look. Remember, should S&P 500 earnings growth come in at 20% (or better, as expected), it will mark the first back to back 20% earnings growth quarters since 2003 (the same year the VRA was founded). With a forward P/E multiple of just 16, you don’t have to love this market but you can no longer say that “it’s expensive”.
What does this tell us? I believe it tells us that Q2 will be another 20% growth quarter. I also believe its telling us that GDP for Q2 will top 4% “easily”…the whisper numbers are now above 5% GDP.
Think about this for a second; if the bears cannot knock the market lower during “sell in May and go away”…or “during the worst 6 month seasonal period of the year (May-October)…or while the MSM is obsessing about “Trump crashing the global economy with his trade war”, then how will the bears knock the market lower during Q3 and Q4, as the US economy finishes the year with full year GDP of 3.5%+ and full year corporate earnings growth of 20%+?
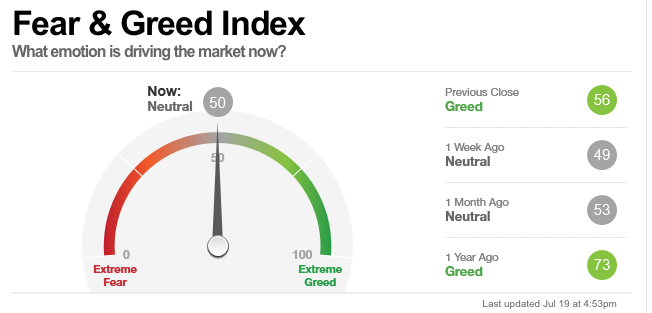
Yes….we are seeing some bears throw in the towel…but we’re still not seeing it in investor sentiment surveys. Below are this weeks AAII Sentiment Survey and CNN/Money Fear and Greed Index.
AAII shows bulls at just 34%, bears at 24% and neutral investors still at an enormous 40%. Once again, this is not how bull markets end. Bull markets end in wild euphoria. Not to worry…..we’ll get there…when the DJ is topping 40,000 and bulls are hitting 70%, we’ll know that things have gotten frothy.

Same with CNN/money Fear and Greed Index, which has just a “neutral” sentiment reading. How remarkable that we’re getting near weekly all time highs in nasdaq and Russell 2000 but investors remain hyper skittish? As a contrarian, we know what this means….pullbacks must be bought.

Heads up on VRA System Readings. Still at 10/12 screens bullish but note that the S&P 500, DJ and Nasdaq are trading at “extreme overbought” levels. Russell 2000 still has room to run. Not a reason to sell anything…but extreme overbought readings can lead to quick, albeit short term sell-offs.
Energy, Oil Update
In running VRA System Screens this week, one primary sector popped up as interesting…oil and energy stocks, most notably, West Tx Intermediate and oil service stocks (OIH).
Long time VRA Members will remember that we were bearish on oil from +$100 back in 2014…we stayed bearish all the way down to the $27 range…then we became bullish at $32/barrel. We’ve remained bullish since and most certainly so today.
Take a look at this 3 year chart of WTI. From our buy signal at $32, oil is up more than 100%. But its the current rising wedge pattern that has my attention today. The move higher over the last 12 months has fit neatly into this rising wedge, meaning that each time the lower line is hit, oil must be bought and that each time the upper line is hit, oil should be sold. Today, oil is right back to its lower line…its hitting heavily oversold levels on our momentum oscillators…and its next move higher should take oil to the (higher high) of $78–80, with $100/barrel possible in 2019.

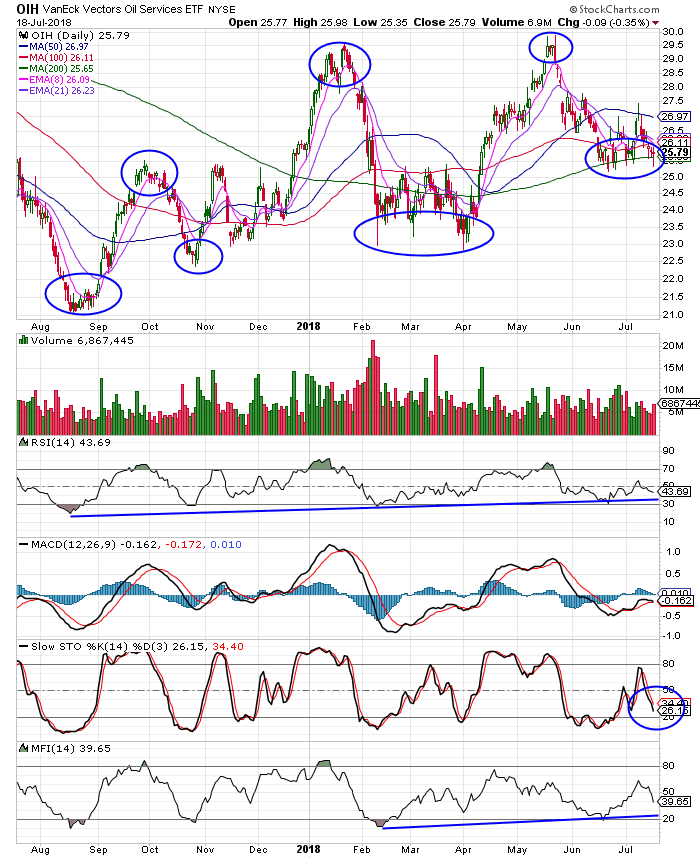
Of the broad energy market sectors that look the most interesting, take a look at the following 1 year chart of OIH, or the Oil Services ETF. OIH meets the very definition of a VRA System Buy Signal. A series of higher highs and higher lows (as seen in circles below), combined with rising technical trend lines across the board (hyper bullish) along with a current test of the 200 dma. Should stochsastics reach extreme oversold levels, OIH would hit a “perfect” buy signal. I’ll have potential targets soon. We will only act if we have the potential for 30–50% gains in a leveraged ETF or 100%+ profit potential in an individual company. Watching this group closely.

Economics Concerns
Finally for this morning, and we get this question often, what’s the biggest short term negative event (domestic) that could take place that would derail our US bull market. There’s not a close second in my mind…it’s the November mid-terms, in less than 4 months. Should Dems win back the house and/or senate, we almost certainly know what their first steps would be. In addition to trying to impeach Trump (not sure what exactly the charge would be, but it wouldn’t stop them from trying) along with an attempt to eliminate/reverse Trumps tax cuts.
While it’s highly unlikely that they could muster the votes for either, trust me when I tell you that the markets dislike uncertainty more than anything. An impeachment trial and tax hikes would be enough to send our markets 20% lower. I have little doubt about this. It’s our biggest short term risk…not a close second.
Dems appear dead set on dying on the hills of Russia and illegal immigration. It’s my continued view that they stand little/no chance of winning back either the house or the senate. I look for R’s to increase their advantage in each chamber, and with this, US equity markets to rock and roll into year end. Our biggest short term worry really is not much of a worry.
Until next time, thanks again for reading…
Kip
To receive access to our full VRA Membership and daily updates(including our VRA Portfolio with buy and sell recommendations, featuring 2400% net gains since 2014), sign up to receive two free weeks from the VRA atwww.vrainsider.com/14day
