VRA Investment Update: Put Buying is Back. High Yield Bonds Exhibiting Remarkable Strength. VRA Commodity Watch
/Good Thursday morning. Quick hitters this AM.
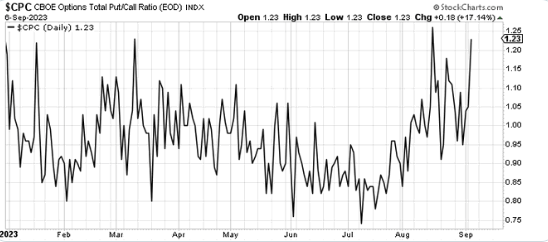
As Tyler covered in yesterday's VRA Investing Podcast, as seasonal weakness continues to weigh on stocks we’re already seeing a sharp rise in put/call ratios.
Below we see that the total put/call ratio is nearing its high water mark of 2023. This is a tell. When the public is buying puts at these high levels Mr. Market is getting ready to pull the rug out from underneath them.
Following the put/call ratio is a smart money strategy (certainly at the extremes)
The biggest concern of investors today is no longer a recession taking place in the US, its the rise in bond yields. This is our biggest black swan risk; sovereign credit risks and the potential for rising debt defaults.
But again, take a look at the chart below of HYG, the largest and most important high yield (junk bond) ETF.
Not only is HYG not melting down, as rates remain stubbornly high, but instead HYG is demonstrating highly bullish technical action.
Again, this is a tell…certainly with rates rising. If we were in danger of credit risks, we would see it in junk bonds first.
Below we see a relative strength chart of HYG to TLT (long term T-bonds). I find this chart remarkable. Again, even in the face of rising yields for govt debt, junk bonds are exhibiting uncanny strength.
Know this; we will only become truly concerned about rising rates if pervasive weakness begins to take place in junk bonds. I can assure you that this is what the Fed is watching as well.
The credit markets always smell the biggest risks first. The action in junk bonds confirms what we’ve been reporting here over the last year; liquidity is powering everything…and today, there are no credit/debt risks on the horizon.
VRA Commodity Watch — Own Energy Stocks and Precious Metals/Miners
We’re seeing excellent price action in both energy stocks and oil with defined bullish channels & technical action.
I see XLE (energy ETF) headed through double top at $92, then clear skies (ATH). Oil looks headed to $92/barrel, then a pause. Our call is for oil to break $100.
In my opinion, most people have no clue how high oil prices are headed. When oil breaks $100, it may be years before it’s back below. These enviro-wackos have damaged the infrastructure of funding and drilling to an enormous degree.They need sky high prices for their garbage “clean energy” to work. There are no accidents here. We’re going to make a fortune in energy stocks.
We own and recommend ERX (2 x Energy ETF). To view our other positions visit VRAinsider.com
Note on ERX: over the last 23 months we have total realized profits of 164%, having traded in and out of ERX 5 times with an average gain per trade of 32.8%.
Making Money with Charles Payne
I was on Fox Business ‘Making Money’ with Charles Payne Tuesday and we talked about our approach to the markets as we navigate the worst month of the year. The primary point that Tyler and I believe that investors should focus on is that we are in a new bull market of size and scope. We are in the first inning of this new bull, which will last for years, based on liquidity, supply and demand, rising corporate profits (lower P/E multiples), a strong US economy and of course our 5 Megatrends from “The Big Bribe”.
We also talked about two sectors that should be bought now; energy stocks and precious metals/miners. As we’ve been focused on here, the charts of oil and energy stocks point to significant moves higher from here, certainly with the rig count at highly depressed levels and supply/demand at dangerously low levels.
Charles asked me about gold, saying “each time we think gold is a buy it reverses lower”. He’s got a good point. Gold has been manipulated lower for decades, however we’ve now entered the most bullish 13 months for gold, based on long term cycle research, and it remains our view that both rates and the dollar will reverse lower; highly bullish for gold/silver/miners.
The chart of gold shows that, even in the face of rising bond yields, gold has ramped higher from $1618/oz last November to $1950/oz today, with a pattern of higher lows and while also bouncing exactly off of its 200 dma in August. Also note that the 200 dma is rising, a clear sign that gold is in a bull market.
We want to see the miners begin to lead gold, something that has yet to kick in. The larger point for everyone at the VRA is our long term strategy of taking 10% of our profits each year from our stock gains and plowing those gains into physical gold and silver. This will have us prepared for “what comes next” when this bull market ends and our investment cycles flip to a potential long term bear market, with gold/silver/miners soaring. Remember, during the Great Depression, the best performing sector was the miners.
Here’s what I know: From my first buy rec of gold in 2003 ($350) and silver ($5), gold has gone up 470% with silver up 370%, while the US dollar has lost value each and every year. I would rather put my savings in assets that appreciate, rather than liabilities that continually lose value.
Here’s the link to the interview: https://rumble.com/v3f5c82-kip-herriage-live-on-making-money-with-charles-payne-sept-5-2023.html
Until next time, thanks again for reading…
Kip
Join us for two free weeks at VRAInsider.com
Sign up to join us for our daily VRA Investing System podcast


