VRA Update: Q3 Earnings, Best in 8 Years. Bull Market Lives On. Oil and Nat Gas. Death Cross in R2K. Investor Sentiment Readings — Extreme Fear.
/Good Thursday morning all.
Some quick hitters to start the day.
Third quarter earnings have absolutely killed it….regardless of how the markets have responded to the results. Yes, we want to watch the “reaction” to the news rather than the news itself, but until we see a semblance of proof that the US economy is decelerating, we must continue to be bullish on both the US economy and equities. Here are the bottom line numbers for Q3 S&P 500 earnings to date:
- S&P 500 EPS +27.9% (vs Q3 ‘17). This is the single best quarter since 2010.
-S&P 500 Q3 earnings are beating expectations by a huge 6.2%
-S&P 500 Q3 revenues are up 8.5%, handily beating estimates (6.5%)
VRA Bottom line: We see NO signs of a slowing economy. Instead, the FED’s 8 straight rate hikes have resulted in a sharp move higher in the US dollar, which in turn has caused headwinds for global equity/currency markets and a slow down in US housing, along with a correction in equity markets, but we continue to view this as a “reset”. A reset that will be followed by the next move to all time highs in US stock markets and a major recovery move higher in global stock markets.
OIL/Nat Gas
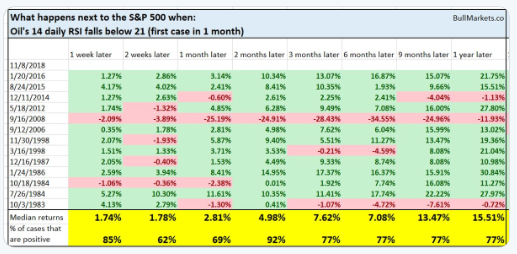
Oil has been hit hard…its the most oversold since the late 2015, early 2016 lows. By some metrics, oil is now MORE oversold than when it bottomed below $30/barrel.
What happens when oil reaches this level of oversold, historically? High odds of a sharp move higher, with median 1 year gains of 15.51% over the next year (with 77% probability). HT to Bullmarkets.co
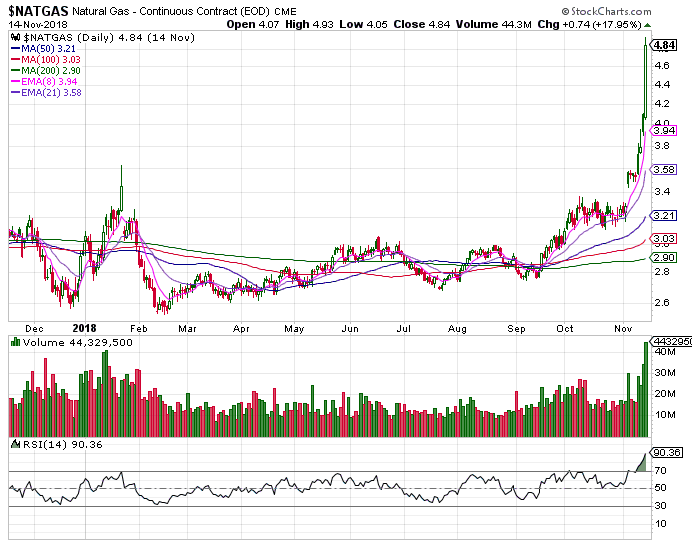
However, know that nat gas has been on fire. The chart below is the very definition of a parabolic move higher. From its Feb lows, nat gas is up a big 64%, a move that has caught traders short gas, while long oil. The move lower in oil is purely technical in nature, produced by traders unwinding their record long positions and then shifting those funds into nat gas.
Death Cross, Russell 2000
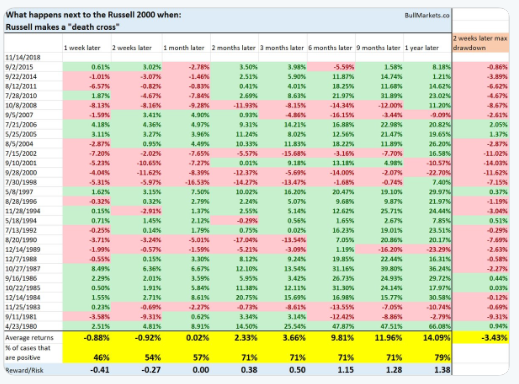
As we’ve discussed this week (and on our daily podcasts, which can be accessed at vrainsider.com), the R2K has now experienced a “death cross”, where the 50 dma crosses over the 200 dma. The inverse is called a “golden cross”. Death crosses have a very real place in technical analysis, but its also helpful to study the analytics of past death crosses. Take a look at the breakdown of all death crosses in the R2K, going back to 1980.
Here’s what we see. Yes, in the very short term (1–2 weeks), a death cross is (slightly) negative. But take a look at what followed 1 full year later. Average gains of 14%. Not exactly befitting of the name.
Sentiment
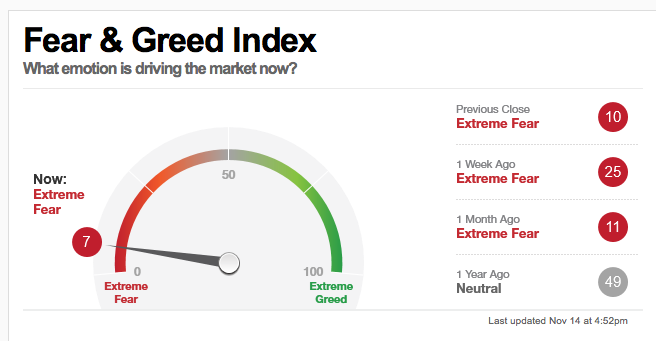
Fear is (once again) running rampant in US equity markets. Take a look at the most recent investor sentiment readings (both updated last night):
CNN/Money Fear and Greed Index @ 7 (extreme fear). Any time this reading gets below 10, we are “very” close to an important market low and reversal higher. VRA Market System readings tell us that weakness may persist this week (momentum oscillators are currently in no mans land), but as we head into next week (Thanksgiving) the year end Christmas rally will begin to kick in.
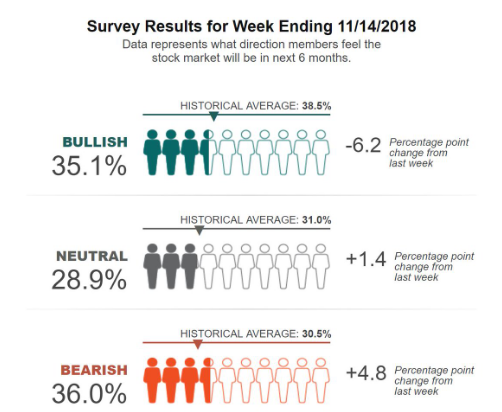
Here’s the weekly AAII Investor Sentiment Survey: 35% Bulls, 36% Bears, 29% Neutral. While the AAII readings have yet to reach extreme fear, here too we see excessive bearishness.
Trade War
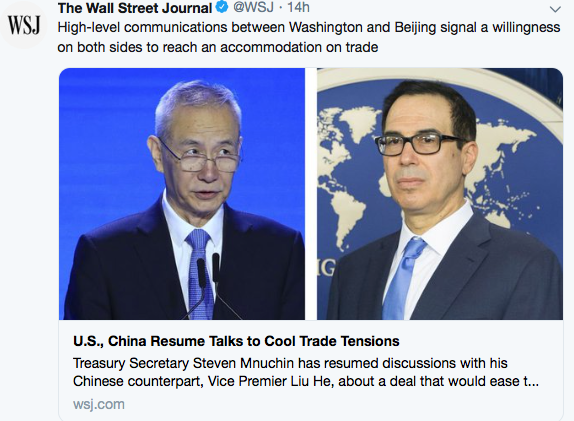
Earlier this week the WSJ reported that US/China trade talks have resumed, at the highest levels. Treasury Secretary Mnuchin is now directly involved. While this has never come close to an actual trade war, the global reset from Trumps trade policy has made its impact felt. We continue to expect a deal prior to year end…very hopefully at the G20 summit at the end of this month.
Bottom line: our views really have not changed. While we cannot rule out a retest of the 10/29 lows, we remain positive on US and global markets.
Until next time, thanks again for reading…
Kip
For our latest updates tune in to our daily VRA Investing Podcast atVRAInsider.com
Since 2014 the VRA Portfolio has net profits of more than 2300% and we have beaten the S&P 500 in 14/15 years.
