VRA Weekly Update: Do Not Sell in May and Go Away. Fearful of Higher Interest Rates? We Should Pray for Higher Rates.
/Good Thursday morning and welcome to the first trading week of May. As we have covered in these pages each year, from 2003 on, May to October are the markets worst 6 months of the year with >90% of all stock market gains occurring from November to April. Typically this is when we would either be setting stops, or at minimum, become more cautious in our trading.
But our “sell in May and go away” analytics don’t look to apply this year. Here’s why:
- We know that May, in post election years, has historically been one of the best months of the year, with average gains in Nasdaq of 3% and 3.9% in Russell 2000, with markets higher 90% of the time. This is actually the best month of the year for small caps (post-election May’s).
- Over the last decade, when the S&P 500 is up by 5% or more in the month of April, the month of May has been higher 9/10 times.
- And we find this data extra compelling; Going back to 1954, when the S&P 500 is higher by 10% + in the first 4 months of the year (it’s happened 18 x), the rest of the year has been positive 88% of the time with avg gains of 7.4% over the remaining 8 months. The S&P 500 is up 11% for the year to date.
- Again, this is the first trading week of May, meaning fresh fund flows from pensions/retirement funds will begin entering our markets today. In addition, share buybacks are all the rage again, now posting the biggest buyback totals since before the start of CV insanity.
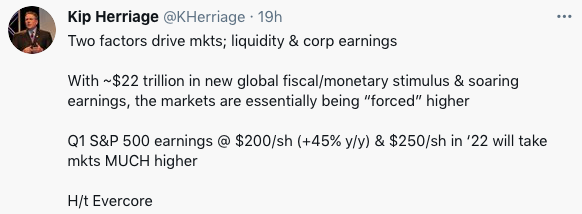
And we have new fundamental research from the all-stars at Evercore that continues to point to a US and global economy that is in early stages of “soaring mode”:
-Retail sales for the month of April (year over year) look like they’ll post stunning gains of 50%, with employment up a big 11%.
- S&P 500 Q2 earnings estimates are $205/share, vs Q2 ’20 of just $112/share, an almost impossible to believe 83% increase!
-Evercore continues to raise their earnings estimates for this year and next, with 2022 S&P 500 estimates of $250/share. As a forward multiple, this would put the P/E multiple for SPX at less than 17. Folks, this is why the markets will continue to rise. It’s essentially why they “must” continue to rise (combined with $22 trillion in fresh stimulus).
We remain long and strong and buyers of dips.
Market Update
While yesterday's trading brought ATH’s (again) in transports, industrials, housing, and financials, we are seeing bouts of weakness in tech and small caps. The primary culprit? Fears of higher interest rates. As misguided as these fears may be…and as I’ll show you next, history tells us these fears are horribly misguided…Treasury Secretary Yellen lit the “higher rates” candle on Tuesday with her remarks that “higher rates may be needed to keep the economy from overheating”. Those fears continue in advance of tomorrow's April jobs report. As Tyler covered in yesterday's podcast, roughly 40% of economists polled by Bloomberg expect1 million jobs created in the month of April. We’re even seeing estimates that 1.5 to 2 million jobs may have been created. Yes, these are hot readings. And no, we are not concerned. In fact, the markets love higher rates and would welcome them with open arms.
Going back to 1962 we’ve had 17 “cycles” of rising rates, with most lasting less than 2 years, from trough to peak. How has the S&P 500 responded to these moves higher in rates? The average gain, over these 17 (very short term) cycles since 1962 has been 21.5%. Just the opposite of a risk-off development, higher interest rates are among the biggest reasons to be fully bullish and risk-on engaged.

Continue to use any weakness to add to positions. We have no idea what the jobs number will be on Friday…we’re rooting for 10 million jobs to have been created…but I do know this; if the average economist is looking for 1 million + jobs to have been created, I’d be very tempted to take the under. More importantly, should rates begin to rise (how many times have we heard this song and dance), here at the VRA we’ll aggressively use those rate hikes to add to our positions. We highly recommend monthly dollar cost averaging into all VRA Buy Recs.
Final note on rates and the markets. We see this market as most closely resembling the 1995–2000 time frame. The dot-com mania melt-up that sent the Nasdaq higher by 575% over 5 years. Guess what the average yield on the 10 year t-note was during that 5 year monster move higher….the average yield on the 10 year from 1995–2000 was 4.75%. This morning, as I write, the 10 year sits at just 1.58%. Put that in your pipe and smoke it, permabears.
Surge in Commodities and Resource Stocks Just Getting Started
Bank of America’s report from Monday of this week is getting serious attention, as it should. The 10 year rolling return for commodities has now turned positive for the first time since 2014, marking the end of the longest period of underperformance since the Great Depression. The brutal bear market that started in the wake of the Global Financial Crisis was a 100-year storm that has deeply scared resource investors and companies. Precisely for that reason, the current bull market is just getting started…as it also appears we have a new global commodity supercycle on our hands.
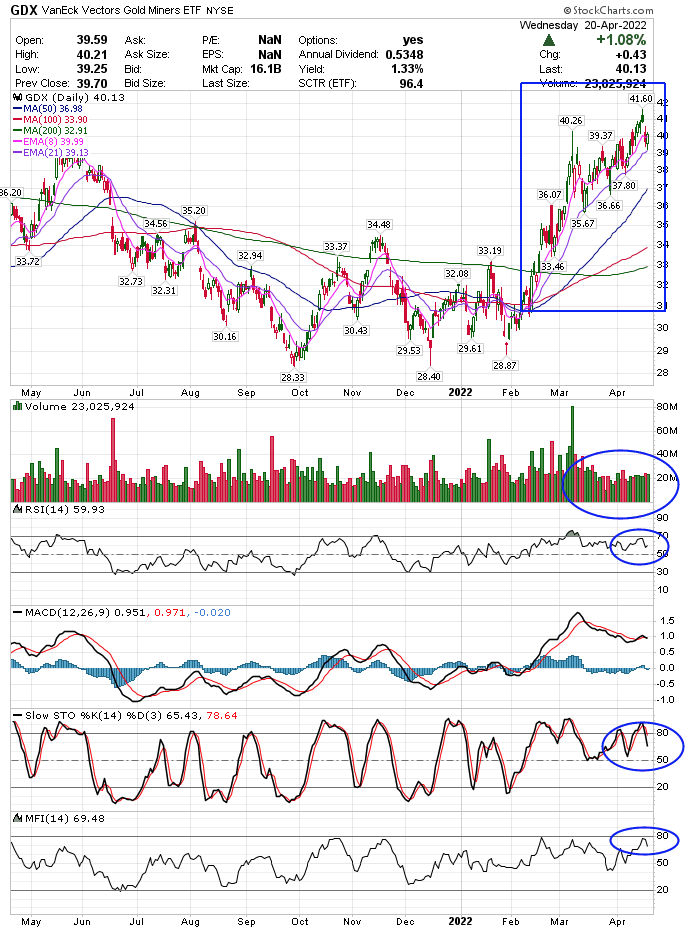
We remain ultra bullish on oil, gold, silver, and copper.
Until next time, thanks again for reading…
Kip
Join us for two free weeks at VRAInsider.com
Sign up to join us for our daily VRA Investing System podcast
Also, Find us on Twitter
